Skill Summary
| Language | Method |
| Python | Hypothesis Testing |
| Python | Working with APIs |
| Python | LDA Method |
| Python | Least Squares Regression |
| Python | Principle Component Analysis |
Extracts from a grad school analysis I ran investigating what agencies have been communicating through social media and the resulting response from constituents.
By looking at tweets of 8 top active agencies on Twitter, I hoped to identify shared topics that agencies are tweeting about and if these topics are a good prediction for retweets – as a proxy for civic engagement. While any study of social media platforms are subject to critique due to questions of adoption, usage and access, looking at what has been tried and its response among citizens may help agencies proactively navigate in the debate by knowing what topics hold their active constituents attention and what areas require other forms of outreach or engagement.
The top eight agencies that represented operational, administrative, emergency and service constituency specific missions were chosen for the analysis. This ‘stratified sample’ was done in order to get the most diversity in types of tweets issued, while minimizing the volume of data under analysis.
The most recent 3200 tweets were pulled using Twelt.com. The Twitter API was used to pull back twitter profiles and the number of followers and status counts for the selected agencies, as of the last update date of 12/12.
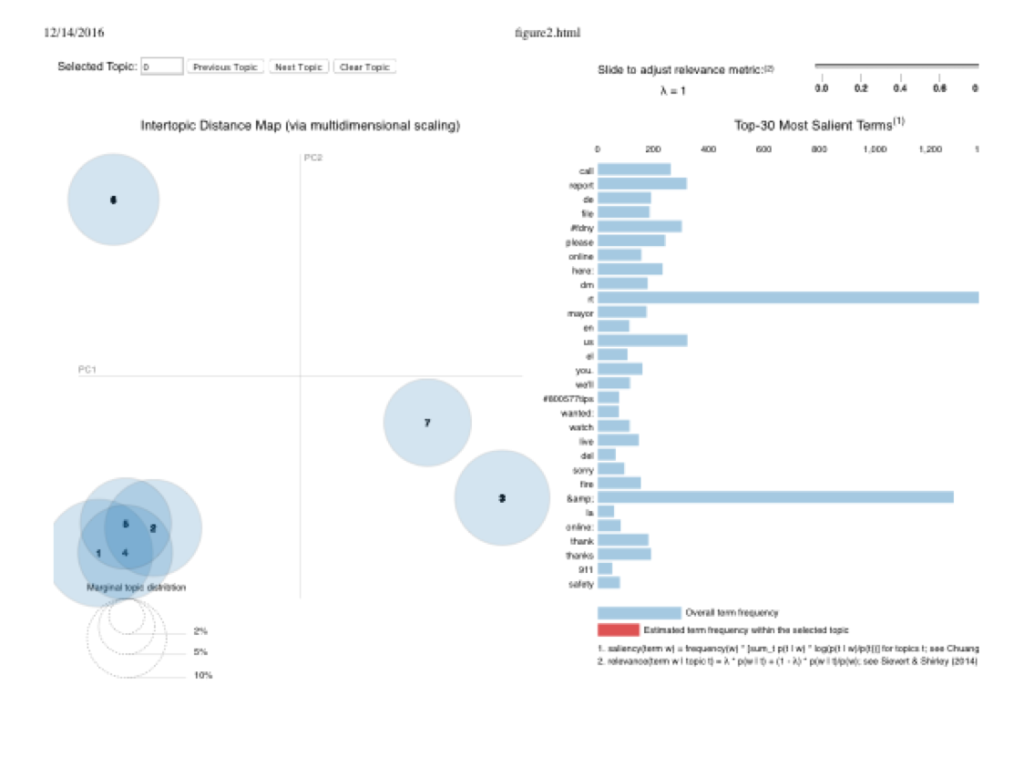
The LDA method, a model that treats a topic as a discrete distribution of words with a probability with concentration and base measure, was used to identify groups of words that formed a topic across all tweets.
Determining the right number of topics was accomplished through trial and error. The LDA model was run several times over a test set of the data at varying alpha, number of topics, and number of passes and then cross validated against training data . The number of topics tried was from 40 down to 5. A final number of 7 was chosen. From trial and error, the higher number of passes led to a greater accuracy in results. Each tweet has it’s own distribution over topics given by probabilities from the model.
My summary of the 7 topics:
Topic 0: Get help here – customer service notice
Topic 1: Call to action
Topic 2: 911 remembrance?
Topic 3: Tweets notifying constituents of the agencies presence on twitter
Topic 4: another customer service type
Topic 5: Event notification
Topic 6: How to
A numpy matrix was extracted from the LDA model listing each tweets probability of belonging to the final list of 7 topics. The probability distributions were treated as features against the number of retweets. An ordinary least squares regression was run, checked for dimensionality reduction using principal component analysis and then I reran the regression with significant features.
Data Sources
www.twelt.com – tweets
www.twitter.com – agency handles and profile summary data
www.opendatanyc.gov – 2011-2012 social media platform counts of city agencies
