
Skill Summary
| Language | Method |
| D3.js v3 | Interactive Data Exploration |
| SQL/BIGQuery | Data Munging |
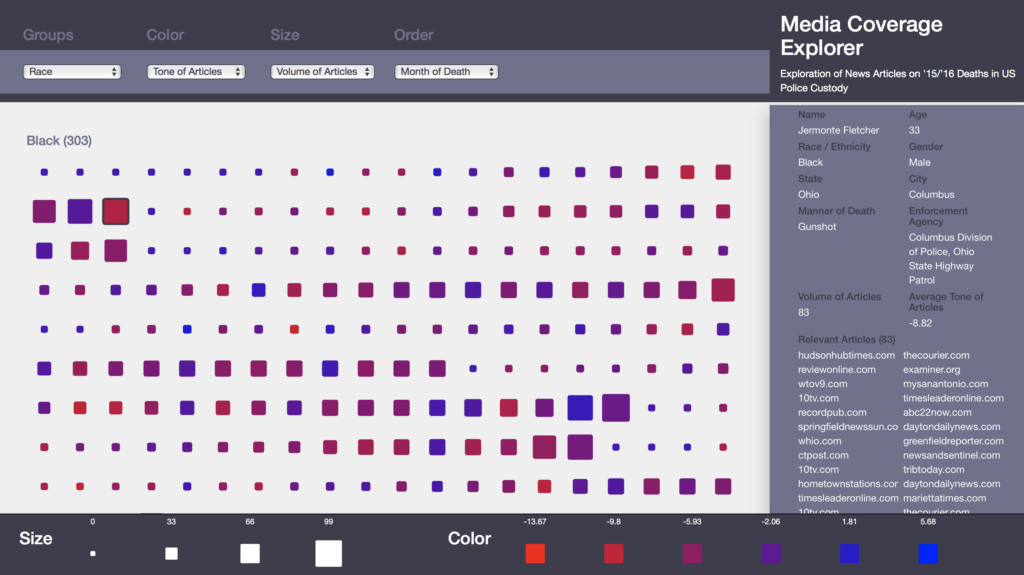 This is an interactive visualization I worked on with Dhia Barnes and Pi Lanningham that enables the user to view 2015 average news article tone, and number of news articles identified for each person who died while in police custody in 2015, as reported by The Counted project from The Guardian.
Selecting each data point brings back the individual’s demographic information and list of source articles. Individuals may be grouped by demographic information and ordered and characterized by their race, avg tone of articles and number of articles identified. The grouping and characterizations allow the user to locate for further review apparent patterns in media coverage, defined as tone and volume of articles, among individuals in the dataset.
We used Google Big Query to get the data and then visualized the lookup tool in D3.
Demo located [HERE]
Video located [HERE]