
• Skip to primary navigation
  • Skip to main content

Lani Mcleod

Analysis & Design Portfolio

  • About Me
  • Analysis
  • Visualization
  • Website Design
Dashboards

Dashboards

February 16, 2018

Skill Summary

Language Method
D3.js v4 Drill-down and stacked bar chart
JQuery Data Munging
Underscore.js Data Munging

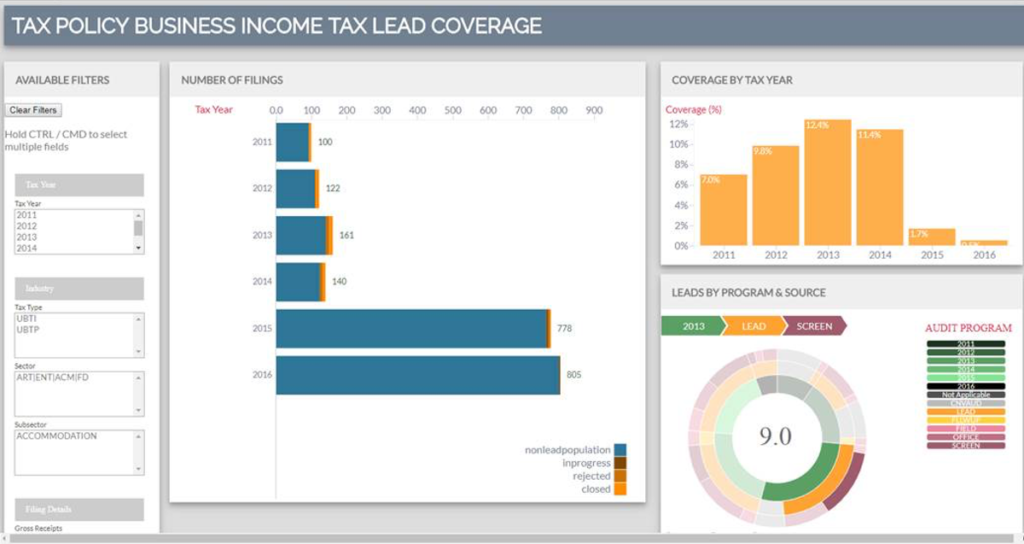
My implementation of a drill-down horizontal bar chart for a dashboard I created for managers to scroll through the business income tax filers and their audit coverage. (Data shown below not actual)
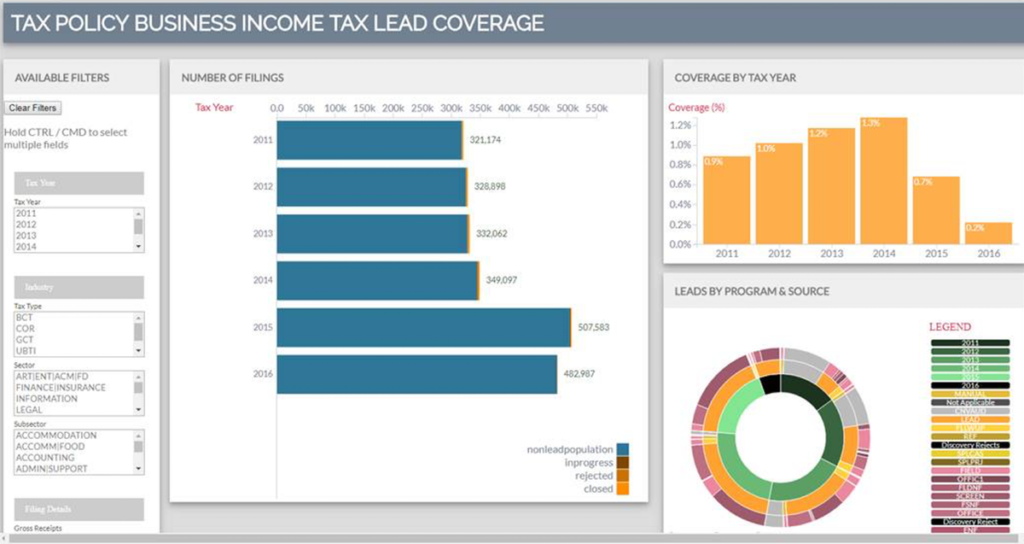
The pie and secondary column chart update based on the drill down level of the main horizontal bar chart. All data can be filtered by various parameters.
Filed Under: Graphic Design, Visualization

Copyright © 2026 · Log in

  • D3 Hexbin as a design feature
  • Re-imagining Tables
  • Civic Engagement and Social Media
  • Subway Station Criticality
  • Dashboards
  • Candlestick Charts – Stock Lookup
  • News Sources
  • Media Explorer
  • Beer and Desserts
  • Tann Global Foundation
  • The Wright Enterprise Group
  • EPIC Collaborative Advisors
  • Sierra Leone Signposts