Skill Summary>
| Language | Method |
| D3 | Mapping with D3 |
| Python | Modeling Demand |
| Python | Community Detection |
| Python | Network Analysis |

Visualization for project with Richard Vecslera, Yuan Shia, Ekaterina Levitskaya, and Sunny Kulkarnia where we identify the synergistic effect of multiple simultaneous station disruptions on the New York City subway system.
The Paper
- NYC Metropolitan Transit Authority (MTA) schedule data provides the arrival and departure times by subway station, line, and day, and time of day. These fields were used to populate network attributes, such as wait, transfer, and travel times, as well as to approximate the availability of stations by time of day and day of week.
- Commuter home-to-work data from the American Association of State Highway (AASHTO) and Transportation Officials provides subway commuter origin-destination matrices by census tract. The data, together with spatial proximities between tracts and subway stations, were used to model the directed passenger flow through the subway network. This demand model is then validated against MTA turnstile data.
- The MTA turnstile data consists of weekly volumes on entries and exits on over 31,000 turnstiles and across nearly 500 subway stations. No link between individual passenger entry stations and exit stations exist. The average counts for entry and exit volumes, by station, date, and time were aggregated by census tract and used for validation against the AASHTO commuter home-to-work data.
- The NYC subway system is modeled as a directed, weighted network; with nodes representing subway stations and their specific platforms, while edges represent the connections between stations and platforms weighted by the travel, transfer and wait time incurred to traverse between a given origin station and a given destination station.
- Passenger demand is distributed throughout the subway system by projecting origin-destination census tract pairs to associated subway pathways by way of a multinomial logit route choice model.
- We defined the impact of a node disruption as a function of passenger flow (“demand”) and the delay experienced due to the disruption given as:

- Using the individual criticality scores for each node and pairs of nodes we then examine the existence of ‘synergy’. We define synergy as the degree to which the criticality of paired disruptions is over and above the sum of the criticality of single disruptions.
The Visualization
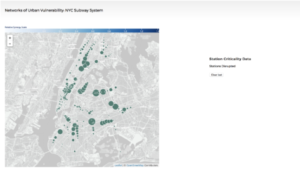
Each node in the network is sized according to their single node criticality score.
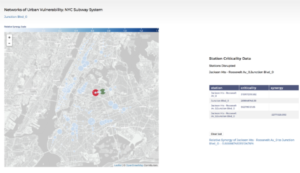
The user is able to select a pair of stations by zooming into an area on the map and clicking on a station.
Once a pair of nodes has been selected the color of the nodes in the network will change according to the scale of the synergistic effect.

Check out the live visualization here: http://bl.ocks.org/lanimc/raw/caa96f80793d104b727e98fa46a6d1aa/
